Example: Investigating Significant Wave Height - Southern California
Show code cell content
import intake_erddap
# import intake
import numpy as np

import cartopy.crs as ccrs

import pandas as pd

from matplotlib import pyplot as plt
from shapely import geometry

from datetime import datetime

def figure(*args, figsize=(18, 8), facecolor='white', **kwargs):
    return plt.subplots(*args, figsize=figsize, facecolor=facecolor, **kwargs)
Here’s an example of finding all stations that have significant wave height from the main IOOS ERDDAP server.
server = 'https://erddap.sensors.ioos.us/erddap'
cat = intake_erddap.ERDDAPCatalogReader(
    server=server,
    standard_names=["sea_surface_wind_wave_significant_height"]
).read()
df = pd.DataFrame([cat[i].metadata for i in list(cat)])
sub_df = df[['datasetID', 'minTime', 'maxTime', 'title']][:5]
sub_df.style.set_table_attributes('class="dataframe docutils"').hide(axis="index")
| datasetID | minTime | maxTime | title |
|---|---|---|---|
| edu_ucsd_cdip_073 | 1976-05-19T10:20:00Z | 2024-07-22T12:20:00Z | 073 - Scripps Pier, La Jolla, CA (LJPC1) |
| gov-ndbc-41001 | 2015-07-22T06:30:00Z | 2024-07-22T10:50:00Z | 41001 (LLNR 635) - EAST HATTERAS - 150 NM East of Cape Hatteras |
| gov-ndbc-41002 | 2015-01-01T00:50:00Z | 2024-07-22T11:00:00Z | 41002 (LLNR 830) - SOUTH HATTERAS - 225 NM South of Cape Hatteras |
| gov-ndbc-41004 | 2015-01-01T00:50:00Z | 2024-07-22T10:50:00Z | 41004 (LLNR 825) - EDISTO - 41 NM Southeast of Charleston, SC |
| gov-ndbc-41008 | 2015-01-01T00:50:00Z | 2024-07-22T11:00:00Z | 41008 (LLNR 833) - GRAYS REEF - 40 NM Southeast of Savannah, GA |
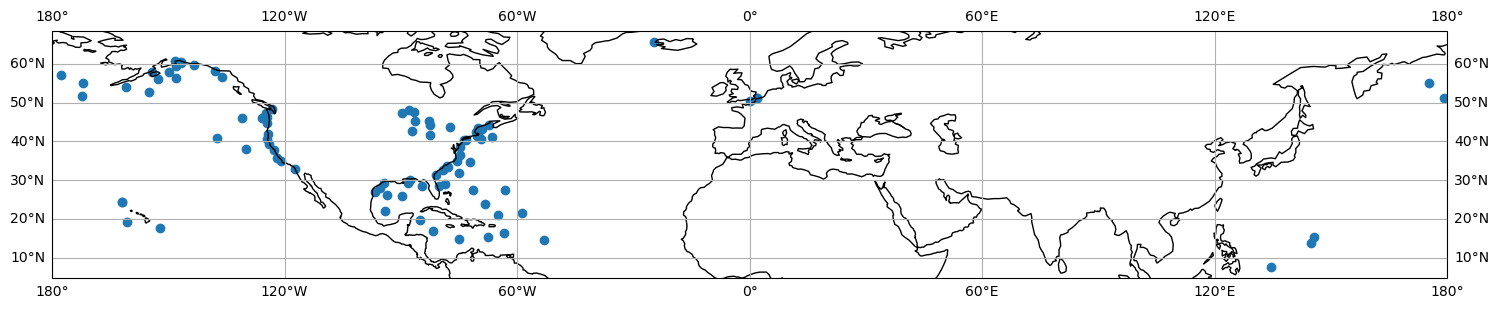
We can plot the locations of these stations on the globe.
fig, ax = figure(subplot_kw=dict(projection=ccrs.PlateCarree()))
ax.coastlines()
ax.gridlines(draw_labels=True)
ax.scatter(df['minLongitude'], df['minLatitude'])
<matplotlib.collections.PathCollection at 0x7f4e250c2e10>
/home/docs/checkouts/readthedocs.org/user_builds/intake-erddap/conda/stable/lib/python3.11/site-packages/cartopy/io/__init__.py:241: DownloadWarning: Downloading: https://naturalearth.s3.amazonaws.com/110m_physical/ne_110m_coastline.zip
  warnings.warn(f'Downloading: {url}', DownloadWarning)
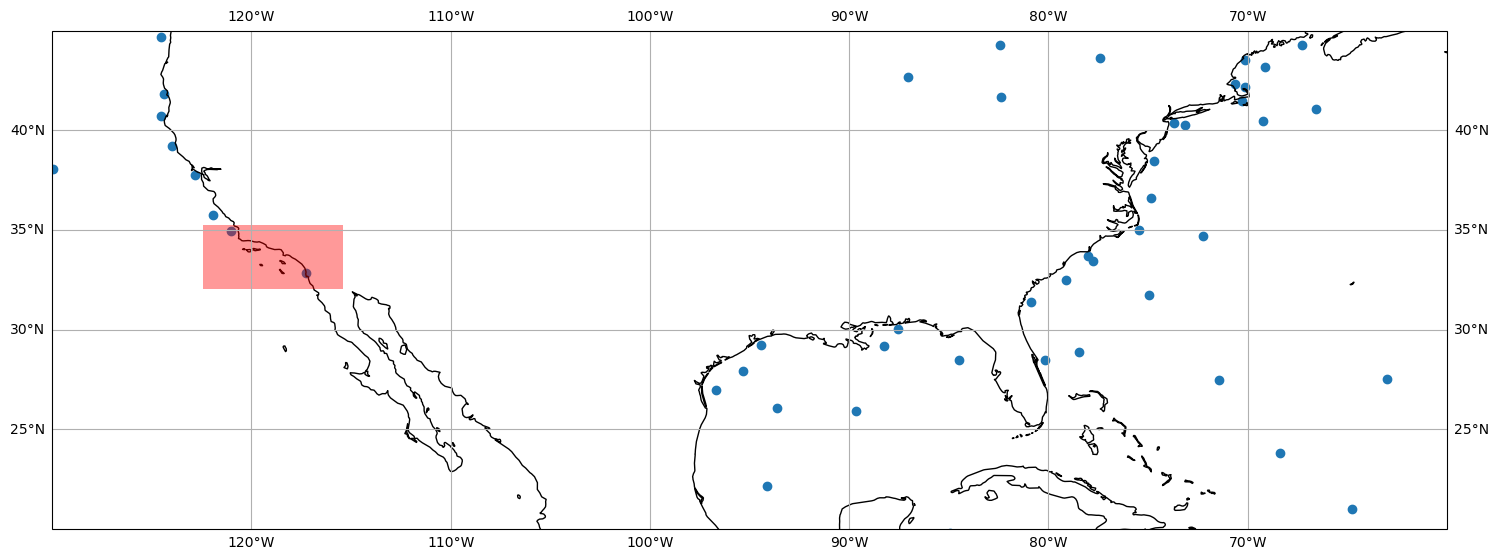
Since our region of interest is off the coast of Southern California, we’ll specify a bounding box and highlight the stations that intersect our region.
# Southern California Region
bbox = (-122.42, 32.04, -115.40, 35.28)
box = geometry.box(*bbox)

fig, ax = figure(subplot_kw=dict(projection=ccrs.PlateCarree()))
ax.coastlines()
ax.gridlines(draw_labels=True)
ax.scatter(df['minLongitude'], df['minLatitude'])
ax.add_geometries([box], facecolor='red', alpha=0.4, crs=ccrs.PlateCarree())
ax.set_extent([-130., -60., 20., 45.], crs=ccrs.PlateCarree())
/home/docs/checkouts/readthedocs.org/user_builds/intake-erddap/conda/stable/lib/python3.11/site-packages/cartopy/io/__init__.py:241: DownloadWarning: Downloading: https://naturalearth.s3.amazonaws.com/50m_physical/ne_50m_coastline.zip
  warnings.warn(f'Downloading: {url}', DownloadWarning)
We can pass this bounding box directly to the ERDDAP Catalog constructor, as well as limit our query only to stations that contain data after 2014 and through 2017. We also will limit the data returned to the variable (through the variables keyword) we are searching for plus basic variables (time, longitude, latitude, and depth):
cat = intake_erddap.ERDDAPCatalogReader(
    server=server,
    bbox=bbox,
    start_time=datetime(2014, 1, 1),
    end_time=datetime(2018,1,1),
    standard_names=["sea_surface_wave_significant_height"],
    variables=["sea_surface_wave_significant_height"],
    dropna=True,
).read()

len(cat)
32
df = pd.DataFrame([cat[i].metadata for i in list(cat)])
sub_df = df[['datasetID', 'minTime', 'maxTime', 'title']]
sub_df.style.set_table_attributes('class="dataframe docutils"').hide(axis="index")
| datasetID | minTime | maxTime | title |
|---|---|---|---|
| edu_ucsd_cdip_028 | 2000-03-16T19:10:06Z | 2024-07-22T13:28:20Z | 028 - Santa Monica Bay, CA (46221) |
| edu_ucsd_cdip_043 | 2008-01-22T15:25:27Z | 2019-07-27T15:28:20Z | 043 - Camp Pendleton Nearshore, CA (46242) |
| edu_ucsd_cdip_045 | 1997-05-19T15:09:34Z | 2024-07-22T13:28:20Z | 045 - Oceanside Offshore, CA (46224) |
| 067-san-nicolas-island-ca-46219 | 1991-09-10T21:24:00Z | 2024-07-22T14:20:00Z | 067 - San Nicolas Island, CA (46219) |
| edu_ucsd_cdip_071 | 1991-10-22T07:52:00Z | 2024-07-22T13:28:20Z | 071 - Harvest, CA (46218) |
| edu_ucsd_cdip_073 | 1976-05-19T10:20:00Z | 2024-07-22T12:20:00Z | 073 - Scripps Pier, La Jolla, CA (LJPC1) |
| 076-diablo-canyon-ca-46215 | 2009-01-01T00:11:55Z | 2024-07-22T10:28:20Z | 076 - Diablo Canyon, CA (46215) |
| edu_ucsd_cdip_092 | 1998-02-21T13:07:00Z | 2024-07-22T13:28:20Z | 092 - San Pedro, CA (46222) |
| edu_ucsd_cdip_093 | 1997-10-23T15:29:59Z | 2016-01-08T23:02:45Z | 093 - Mission Bay Offshore, CA (46231) |
| edu_ucsd_cdip_096 | 2000-07-11T15:09:24Z | 2016-03-09T01:09:45Z | 096 - Dana Point, CA (46223) |
| edu_ucsd_cdip_100 | 2001-01-30T00:17:11Z | 2024-07-22T13:28:20Z | 100 - Torrey Pines Outer, CA (46225) |
| edu_ucsd_cdip_101 | 2001-04-30T16:19:44Z | 2022-03-09T19:20:00Z | 101 - Torrey Pines Inner, CA (46273) |
| edu_ucsd_cdip_103 | 2001-10-11T23:53:31Z | 2024-07-22T13:45:00Z | 103 - Topanga Nearshore, CA (46268) |
| edu_ucsd_cdip_107 | 2002-06-26T19:05:43Z | 2016-11-02T20:14:45Z | 107 - Goleta Point, CA (46216) |
| edu_ucsd_cdip_111 | 2002-06-28T17:25:10Z | 2019-05-13T02:03:27Z | 111 - Anacapa Passage, CA (46217) |
| edu_ucsd_cdip_138 | 2015-03-17T15:06:27Z | 2017-04-02T01:47:07Z | 138 - Begg Rock, CA (46255) |
| edu_ucsd_cdip_155 | 2006-12-19T18:00:10Z | 2024-07-22T13:28:20Z | 155 - Imperial Beach Nearshore, CA (46235) |
| edu_ucsd_cdip_191 | 2007-10-03T17:53:59Z | 2024-07-22T13:28:20Z | 191 - Point Loma South, CA (46232) |
| edu_ucsd_cdip_201 | 2013-03-27T19:17:45Z | 2024-07-22T13:28:20Z | 201 - Scripps Nearshore, CA (46254) |
| 203-santa-cruz-basin-ca-46251 | 2015-07-16T16:20:27Z | 2024-07-22T14:20:00Z | 203 - Santa Cruz Basin, CA (46251) |
| edu_ucsd_cdip_208 | 2014-01-17T23:00:00Z | 2014-07-19T05:00:00Z | 208 - Torrey Pines North, CA |
| edu_ucsd_cdip_212 | 2014-10-01T18:04:27Z | 2015-12-03T15:36:07Z | 212 - Anacapa Passage South, CA (46252) |
| edu_ucsd_cdip_213 | 2014-10-15T23:03:45Z | 2024-07-22T13:28:20Z | 213 - San Pedro South, CA (46253) |
| edu_ucsd_cdip_215 | 2015-06-08T21:21:27Z | 2024-07-22T13:28:20Z | 215 - Long Beach Channel, CA (46256) |
| edu_ucsd_cdip_216 | 2015-07-09T17:03:45Z | 2017-07-24T19:02:45Z | 216 - Harvest Southeast, CA (46257) |
| edu_ucsd_cdip_218 | 2015-09-30T20:02:45Z | 2015-10-14T18:01:45Z | 218 - Imperial Beach West, CA |
| edu_ucsd_cdip_220 | 2016-01-14T23:03:45Z | 2024-07-22T13:28:20Z | 220 - Mission Bay West, CA (46258) |
| 222-santa-lucia-escarpment-ca-46 | 2016-03-03T18:00:00Z | 2024-07-22T14:28:20Z | 222 - Santa Lucia Escarpment, CA (46259) |
| edu_ucsd_cdip_223 | 2016-03-09T18:00:00Z | 2016-03-18T18:55:00Z | 223 - Silver Strand Anchorage 151, CA |
| edu_ucsd_cdip_229 | 2017-03-18T18:03:45Z | 2017-04-07T17:02:45Z | 229 - San Nicolas Island East, CA |
| edu_ucsd_cdip_234 | 2017-09-24T01:03:45Z | 2018-11-20T17:02:45Z | 234 - Santa Barbara Island North, CA (46262) |
| gov-ndbc-46011 | 2015-01-01T00:50:00Z | 2024-07-22T10:50:00Z | 46011 (LLNR 215) - SANTA MARIA - 21NM NW of Point Arguello, CA |
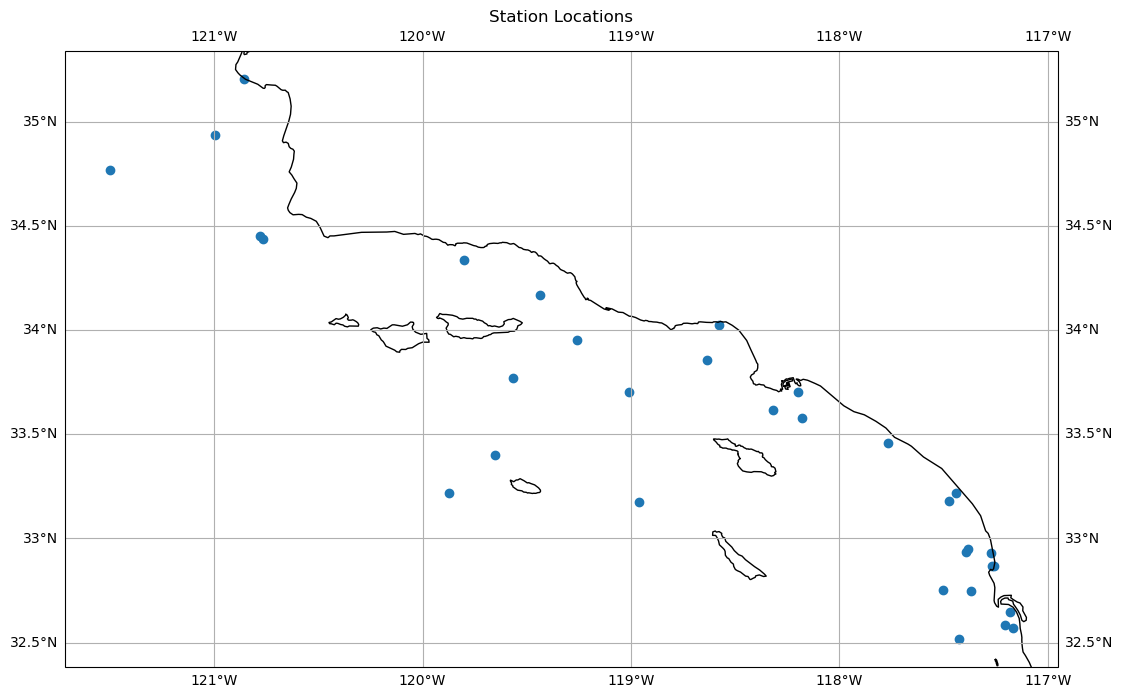
# Southern California Region
bbox = (-122.42, 32.04, -115.40, 35.28)
box = geometry.box(*bbox)

fig, ax = figure(subplot_kw=dict(projection=ccrs.PlateCarree()))
ax.coastlines()
ax.gridlines(draw_labels=True)
ax.scatter(df['minLongitude'], df['minLatitude'])
ax.set_title("Station Locations")
Text(0.5, 1.0, 'Station Locations')
/home/docs/checkouts/readthedocs.org/user_builds/intake-erddap/conda/stable/lib/python3.11/site-packages/cartopy/io/__init__.py:241: DownloadWarning: Downloading: https://naturalearth.s3.amazonaws.com/10m_physical/ne_10m_coastline.zip
  warnings.warn(f'Downloading: {url}', DownloadWarning)
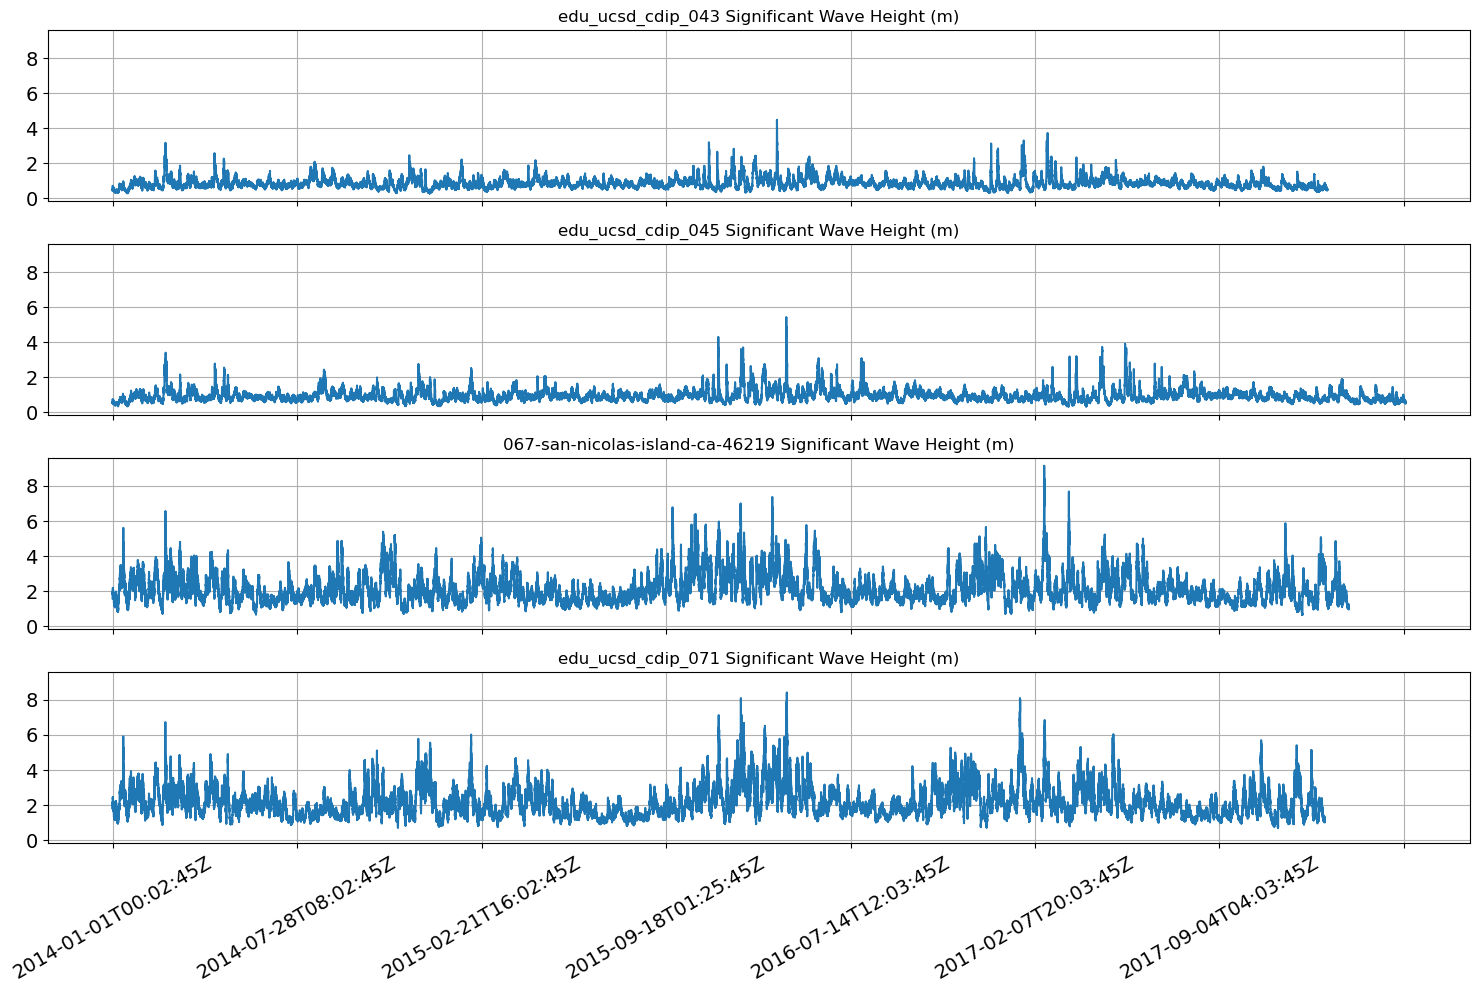
We can now interrogate each of those stations and get a timeseries for the significant wave height data. We’ll use the first four that contain wave height data.
# Just get 4 that aren't empty
stations = {}
for dataset_id in list(cat):
    df = cat[dataset_id].read()
    if len(df) > 0:
        stations[dataset_id] = df
        if len(stations) == 4:
            break
fig, axs = figure(nrows=len(stations), figsize=(15,10), sharex=True, sharey=True)

for i, (dataset_id, df) in enumerate(stations.items()):
    ax = axs[i]
    df.plot(ax=ax, x='time (UTC)', y='sea_surface_wave_significant_height (m)', fontsize=14, rot=30,
            title=f'{dataset_id} Significant Wave Height (m)', legend=False, xlabel="")
    ax.grid()

fig.tight_layout(pad=1)